Highlights
- Threads will now offer detailed metrics on likes, replies, reposts, follower growth and audience demographics by region, age and gender.
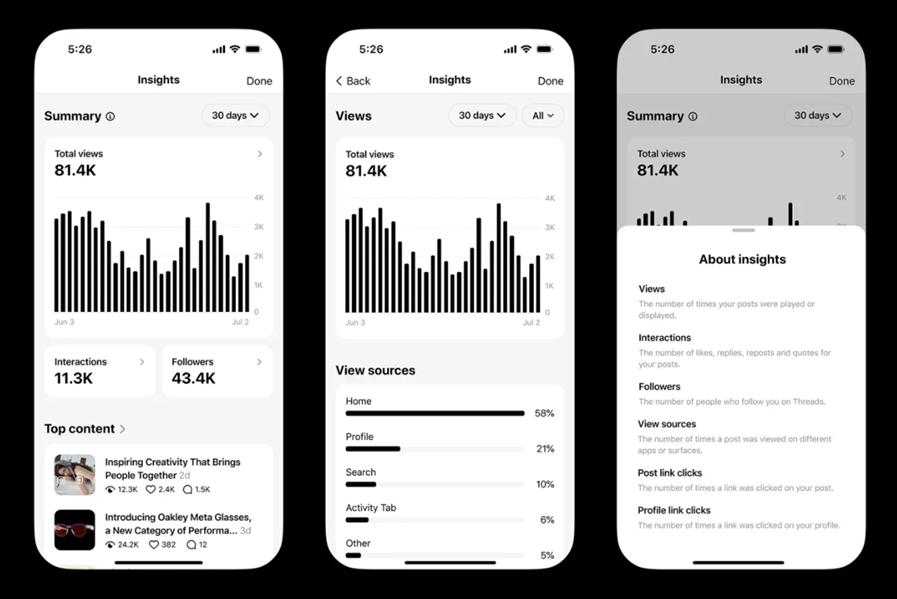
- Users can monitor post performance trends with a new chart spanning 7 to 90 days and view traffic sources across Instagram and Facebook.
- Threads hit 115.1M daily active users in June 2025 (up 127.8% YoY), narrowing the gap with X.

Caption – Threads expands Insights metrics. (Photo by Azamat E on Unsplash)
Threads is rolling out improved analytics tools aimed at giving users a clearer view of how their content is performing and where it’s being discovered. The company recently made the announcement in a Meta Newsroom post titled “New Threads Features for a More Personalized Experience That You Control.”
With the latest update, users now have access to more detailed data in the platform’s “Insights” dashboard. In the “Interactions” section, users can view engagement metrics broken down by likes, replies, quotes, and reposts. The “Followers” section now offers insights into follower growth along with geographic breakdowns such as top cities and countries, and demographic details like age range and gender.
Meta post explained, “You can now tap metrics within the Insights dashboard for more detailed information. For example, tapping the Interactions section shows engagement by likes, replies, quotes and reposts, while tapping the Followers section shows follower growth with geographic data, including top cities and countries, and demographic information like age range and gender.”
Caption – Threads’ new metrics. (Image credit – Meta)
A new chart has also been added to help users track how their post performance evolves over time. It displays content trends across a customisable window ranging from seven to 90 days.
Since eligible Threads posts can appear in recommendations on Instagram and Facebook, the platform now lets users see where their content is being viewed. The update shows the percentage of views generated by each app.
According to the Meta-owned company, these changes are intended to help creators build their audience, increase their visibility and better understand what kind of content resonates with their followers.
The update comes amid Threads’ rapid growth. Data from market intelligence firm Similarweb shows the platform is gaining ground on its main rival, X.
In June 2025, Threads’ iOS and Android mobile app recorded 115.1 million daily active users, marking a 127.8% increase year-over-year. In contrast, X had 132 million daily active users, but its year-over-year growth dipped by 15.2%.
As Threads continues its push against X and other competitors, equipping creators with advanced tools to analyse and grow their content presence seems like a logical next step.
FAQs
Q1. What new engagement metrics can users see in Threads’ Insights dashboard?
Answer. Users can view engagement metrics broken down by likes, replies, quotes, and reposts.
Q2. How does Threads help track audience demographics and growth?
Answer. The “Followers” section shows follower growth with geographic data, including top cities and countries, and demographic information like age range and gender.
Q3. Can users see where their Threads posts are being viewed across other platforms?
Answer. The update shows the percentage of views generated by each app, including Instagram and Facebook.
Also Read: Apple finally joins Threads, instantly gains nearly 5 million followers
Also Read: Threads finally gets direct messaging and visual highlights with new global rollout